

Introduction
Many fitness programs require that you know one or more of your repetition maximums (RM). For example, High Intensity Training (HIT) generally requires you to work with your 8-12RM. With German Volume Training (GVT), you often work with roughly your 20RM. And, with Hypertrophy-Specific TrainingTM (HST), you'll need to find your 15RM, 10RM, and 5RM weights for each exercise that you plan to use in your training cycle [1-3].
For those readers that are new to the iron game, a RM specifies the maximum number of times you can lift a weight before hitting muscular failure. With HST, the RMs guide you in determining how much weight to use for your exercises. For instance, what is the maximum weight you can squat 15 reps with? Once you know this weight, it becomes your 15RM weight.
One way to determine your RMs is to actually perform the exercises. You can test your 15RM on Monday, your 10RM on Wednesday, and your 5RM on Friday. A good thing about this method is that it's very accurate on an individual basis. One drawback is that it takes an extra week to test all of your RMs, and the weights may vary depending on a variety of factors, such as sleep, nutrition, stress, recent illness, overtraining, and the like.
 Estimation is a far less time consuming way of finding your RMs. With the estimation method, you use printed [4] or online Rep-Max calculators [5-8], or some other similar device to estimate your 15RM, 10RM, and 5RM based on other RMs that you already know, such as, for instance, your 8RM or 12RM. A good thing about estimating your RMs is that it's easy and takes very little time. A drawback is that Rep-Max calculators are based on the performance of a wide variety of lifters.
Thus, these calculators do a poor job of predicting reasonably accurate RMs for individual lifters. Moreover, most Rep-Max calculators focus on Squats, Deadlifts, and Bench Presses. But what about your other lifts? Wouldn't it be nice to know your RMs for, say, Rows or Chin-ups?
A more accurate approach is to use a theoretical method to determine your 15RM, 10RM, and 5RM based on your latest RMs from your other workout programs. A great thing about this approach is that it's very accurate on an individual basis. Of course, the main drawback is that it involves mathematics, and not everyone is comfortable enough with his or her math skills to use this method. But fear not! Herein, a straightforward approach is provided for determining your, or your clients', RMs.
Finding Your Repetition Maximums
The first step is to identify at least two of your RMs for each exercise you wish to use in your training. If you already know your RMs, that's great! But if you don't know at least two RMs for each exercise, then you'll have to test for them.
-
Pick your exercises here.
Put some weight on the bar and lift as many times as you can until you hit concentric muscular failure. Record the weight and the number of reps you performed. After a suitable rest, throw some more weight on the bar, and then rep out again. Record this weight and the number of reps you performed. Although you can do this as many times as wish, herein we'll confine ourselves to recording only two different RMs. If you already know your RMs from your previous training, then you can just use those values instead of performing the testing discussed above.
Drawing A Graph
Now that you know some of your RMs, you'll need to plot them on a graph. This graph will express the weights you can lift in terms of the number of repetitions you can perform with those weights. Begin by drawing two lines; a vertical axis and a horizontal axis, as shown below. Label the vertical axis "Weight (lbs)" and the horizontal axis "Reps." To be thorough, you should title the graph "Weight vs. Reps."
Sample Chart:
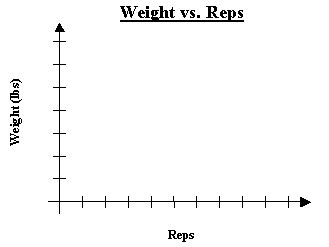
Click To Enlarge!
It's a good idea to date your graph. As your performance changes over time (e.g., you are able to lift more weight for more reps), the information you enter in the graph will need to be updated, accordingly. Although this may seem like a lot of work, the beauty of the graphing approach is that it will give you fairly accurate, individualized results every time.
The next step is to break each axis into a series of equal segments that represent values along each of the axes. That way, you can use the axes for recording the weights you can lift and the numbers of reps you can perform with those weights. An example of this is shown in the graph below. As you can see, the Reps axis is broken into ten equal segments, each of which representing two repetitions. This enables you to record the number of reps you perform with a given weight.
The Weight axis is a bit more tricky, and depends on the particular exercise you are analyzing and the weights you can lift for a variety of repetition values. Let's consider an example that keeps things simple. Suppose you know you are capable of bench pressing 160 lbs for 8 reps and 140 lbs for 13 reps.
Thus, you know your 8RM and 13RM for the Bench Press. But we want to know essentially all of your RMs, all the way from your 1RM to, say, your 20RM. Because of this, we need the Weight axis to include enough weight values to accommodate all of the weights you can possibly lift for this exercise. In this example, therefore, let's have the Weight axis start at 60 lbs and finish at 200 lbs.
Our graph then looks like this:
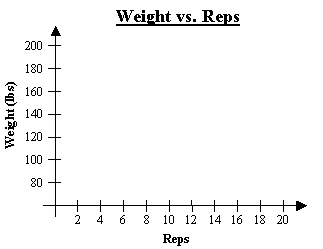
Click To Enlarge!
As you can see, each segment along the Weight axis represents a weight of 20 lbs. Note that we have omitted weight values less than 60 lbs because we assume that you can perform more than 20 reps with those weights. It should also be understood that although we have expressed weights in terms of pounds (lbs), you can just as easily express your weights in terms of kilograms (kg), so long as you use the same units throughout.
Plotting RMs
Once the graph has been set up, it's time to plot your RMs on the graph. Suppose your 8RM is 160 lbs. This is your first data value. To plot this data value on the graph, draw a dashed line from the 8 Reps value on the Reps axis all the way up through the graph. Be sure that this line is parallel to the Weight axis.
Next, draw a second dashed line from the value 160 on the Weight axis all the way across the graph. This second dashed line should be parallel to the Reps axis. Notice that the two dashed lines intersect. The point where the two lines intersect is your 8RM, so draw a small dot at that point.
The graph should now look like this:

Click To Enlarge!
Suppose your next data value is a 13RM of 140 lbs. The procedure for plotting this RM on the graph is the same as for the 8RM. Begin by drawing a vertical dashed line which starts at the 13 Reps value on the Reps axis and goes all the way up through the graph. The second dashed line is horizontal and starts at the value 140 on the Weight axis and goes all the way across the graph. Where these two lines intersect each other is your 13RM. Draw a small dot where the two lines intersect.
The graph should now look like this:
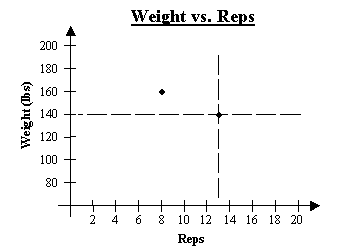
Click To Enlarge!
As you can see, the graph now contains two distinct RM values. It should be noted that we could plot more RM values to make things even more accurate. Of course, doing so would make things a bit more complex and thus goes beyond the scope of this introductory exercise.
Drawing A 'Best-Fit' Line
Once you have two data points plotted on the graph, you're ready to draw a "best-fit" line through the points. This line is called a "best-fit" line because if you were using more than two data points, there's a good chance that a straight line would not pass through all the points. In that case, you'd have to draw the line so that it was as close as possible to all of the points. Hence the name "best-fit" line.
In our present example, however, we are dealing with only two data points; our straight line is guaranteed to pass through both points. Line up a ruler or other straight-edge so that it's aligned with both data points and then draw the best-fit line so that it passes through both points and also crosses over the Weight axis.
The graph should then look like this:

Click To Enlarge!
Notice that the best-fit line passes over the vertical Weight axis. It is important to make sure your best-fit line crosses the Weight axis as will become more apparent below.
Determining RMs
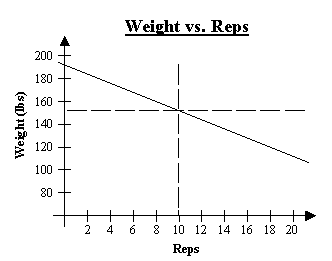
You can use the best-fit line to determine your RMs for any weight. One way to do this is by looking at the values on the graph. For example, suppose you want to know how much weight you can lift for 10 reps (i.e., your 10RM). Draw a vertical line from the 10 Reps value on the Reps axis all the way up to the best-fit line.
Then, draw a horizontal line from the point where your vertical line intercepts the best-fit line all the way over to the Weight axis. Looking at where the horizontal line crosses the Weight axis, you can easily see that your 10RM is about 152 lbs.
Click To Enlarge!
Another way to determine your RMs is by using an equation for the best-fit line. Such a line equation is expressed in the general form
 (1)
(1)
This equation gives the weight (W) that you can lift in terms of the number of reps (R) that you can perform. In Eq. (1), W is a weight value you want to determine, R is the number of reps you want to perform with the weight, m is the slope of the line, and b is an intercept where the best-fit line crosses, or intercepts the Weight axis.
The intercept b can be determined simply by looking at where the best-fit line crosses the Weight axis. In our example, the intercept b is about 192 lbs. The slope m of the line can be determined by using the equation:
 (2)
(2)
The values {W1, R1} and {W2, R2} are respective weight and rep values of any two points that you select on the best-fit line. Because we have used only two RM values to draw the best-fit line, you can use the values again to determine the slope m. It should be noted, however, that had we used more than two RMs to draw the best-fit line, then those RM values could not be used to determine the slope m of the line, at least not unless they were actually positioned on the best-fit line. In general, you must select points that are positioned on the line; otherwise the accuracy of your calculations will be sacrificed.
Using our 8RM and 13RM values, given above, the two points {W1, R1} and {W2, R2} become {160 lbs, 8 reps} and {140 lbs, 13 reps}, respectively. The slope m of the best-fit line is then determined as follows:

As you can see, the slope m is a negative number expressed in terms of lbs per rep. Note that it is okay to have a negative number for the slope m; it just means that the best-fit line slopes towards the Reps axis as it extends further to the right. Now that we have values for the slope m and intercept b, we can put them into the equation for our best-fit line. Doing this gives:
 (3)
(3)
Notice that we have included the units lbs and reps in the equation. This helps us to keep track of the types of values that are included in the equation, and also reminds us that when we enter rep-values, the equation produces weight-values.
You can determine your weights by plugging in some rep-values. One value that everyone likes to know is their 1RM. Let's use Eq. (3) to determine your 1RM for the Bench Press by setting R equal to 1 rep. Doing this gives W = 188 lbs. Thus, in this example, you can lift about 188 lbs roughly one time. Now let's set R equal to 10 reps. Carrying this out gives W = 152 lbs. Therefore, you can lift 152 lbs about 10 times.
Having an equation for each of your exercises is particularly useful for setting up your HST cycles. You can use these equations to quickly predict theoretical values for your 15RM, 10RM, and 5RM for each exercise you want to use in your HST cycle. Continuing with the example given above, we already know that your 10RM for the Bench Press is about 152 lbs, but we want to know your 15RM and 5RM, too. Setting R equal to 15 reps gives W = 132 lbs, and setting R equal to 5 gives W = 172 lbs. Therefore, your 15RM, 10RM, and 5RM are 132 lbs, 152 lbs, and 172 lbs, respectively.
Percent Of 1RM
Many printed and online Rep-Max calculators express the weights you are using as fractions or percentages of your 1RM; and indeed, there may be times when those values are more useful than the values given by Eq. (3). As mentioned above, however, many Rep-Max calculators are based on a large spectrum of lifters and thus may not be very accurate on an individual basis. In this section, we demonstrate ways to determine accurate, individualized fractions of your, or your clients', 1RM.
For any exercise that you perform, the weight that you lift can be viewed as a fractional value of the maximum weight that you can lift one time. This fractional value can be expressed simply as whatever weight you are using divided by your 1RM weight:
 (4)
(4)
Where W is the weight you are using and WM is your 1RM weight. Next, we return to Eq. (1) and notice that when we set R = 1 to represent your 1RM weight, we obtain:
 (5)
(5)
Where we have again used WM to represent your 1RM weight. Upon substituting Eq. (5) into the denominator of Eq. (4) to eliminate WM, we arrive at:
 (6)
(6)
This equation expresses the weights you use as fractions of your 1RM.
Let's use Eq. (6) in an example. Suppose you've been bench pressing 160 lbs for 8 reps, and you want to express this weight as a fraction of your 1RM. Referring to Eq. (3), recall that the intercept b is 192 lbs and the slope m is - 4 lbs/rep. Putting these values into Eq. (6) gives:
 (7)
(7)
Setting W = 160 lbs then leads to:

Thus, in this example, 160 lbs is about 85% of your 1RM for the Bench Press.
Just as you can express your weights as fractions of your 1RM, you can also express fractions of your 1RM as weights. This is useful in those instances when you need to convert a particular fraction of your 1RM into a weight value. For example, say you want to work with 65% of your 1RM on a light Bench Press day. So how much weight should you pile onto the bar? To find out, first solve Eq. (6) for the weight W:
 (8)
(8)
This equation converts fractions of your 1RM into weight values. Now, we already know from Eq. (7) that (b + m) = 188 lbs. Using this and setting f = 0.65 then gives:

Therefore, if you want to work with 65% of your 1RM for the Bench Press, you should pile about 122 lbs onto the bar. Equations (7-8) provide simple conversions between weight values and fractions of your 1RM. But now we need to obtain an equation that expresses fractions of your 1RM in terms of the number of repetitions you can perform. This is most simply done by equating the right-hand side of Eq. (8) with the right-hand side of Eq. (1):
 (9)
(9)
Solving this expression for the fraction f then gives:
 (10)
(10)
This equation gives you a fraction of your 1RM when you enter a number of repetitions that you can perform. Equation (10) is best understood by using an example. Returning again to our Bench Press example, we note that the intercept b is 192 lbs and the slope m is - 4 lbs/rep, and that (b + m) = 188 lbs. Plugging these values into Eq. (10) and performing some minor simplification leads to:
 (11)
(11)
Upon further simplification, we then arrive at the expression:
 (12)
(12)
This equation gives you fractions of your 1RM for the Bench Press when you enter numbers of repetitions that you can perform. Let's use Eq. (12) to determine what the fraction of your 1RM is when you can perform 8 reps with a particular weight. Setting R = 8 reps and performing the computation leads directly to

Therefore, according to this example, you can bench press about 85% of your 1RM for 8 reps.
Conclusions & Discussion
HST and many other fitness programs require you to determine your RM weights for each exercise that you plan to use in your training cycle. Typically, you'd have to spend an extra week testing your RMs, take a wild guess, or use Rep-Max calculators. Although estimating your RMs is easy and takes very little time, a drawback is that Rep-Max calculators generally are based on the performance of many different lifters.
Because of this, these calculators do a poor job of predicting accurate RMs on an individual basis.
A far more accurate approach has been presented herein. Whether you need to know your own RMs, or those of your clients, the methods demonstrated herein enable you to provide an individually tailored analysis for any lifter, at any time, for any exercise. One thing to keep in mind, however, is that as your performance changes over time, the data you use to determine your RMs will have to be updated accordingly.
References
- Haycock, Bryan, "Hypertrophy-Specific Training: Official HST Method, More Info.
- HST FAQ, More Info.
- Discussions on the HST Forum, More Info.
- Hatfield, Frederick C., Fitness: The Complete Guide, International Sports Sciences Association, 7th Ed., p. 5.18.
- Several Rep-Max calculators can be found at Bodybuilding.com, "Predicting Your One-Rep Max,"
- ExRx.net, "Predicting One-Rep Max," http://www.exrx.net/Calculators/OneRepMax.html
- The Pumping Station, "1 Rep Max Calculation Chart," http://www.thepumpingstation.com/1repmax.html
- WeightsNet, "One-Rep Max Calculator," http://www.weightsnet.com/Misc/calculators.html
Thanks,