Newest Bodybuilding.com Articles


More Recent Bodybuilding.com Articles
-
![Bodybuilding.com Elite™ Advanced Test]()
Bodybuilding.com Elite™ Advanced Test
-
![Foot and Ankle Stability Routine]()
Foot and Ankle Stability Routine
-
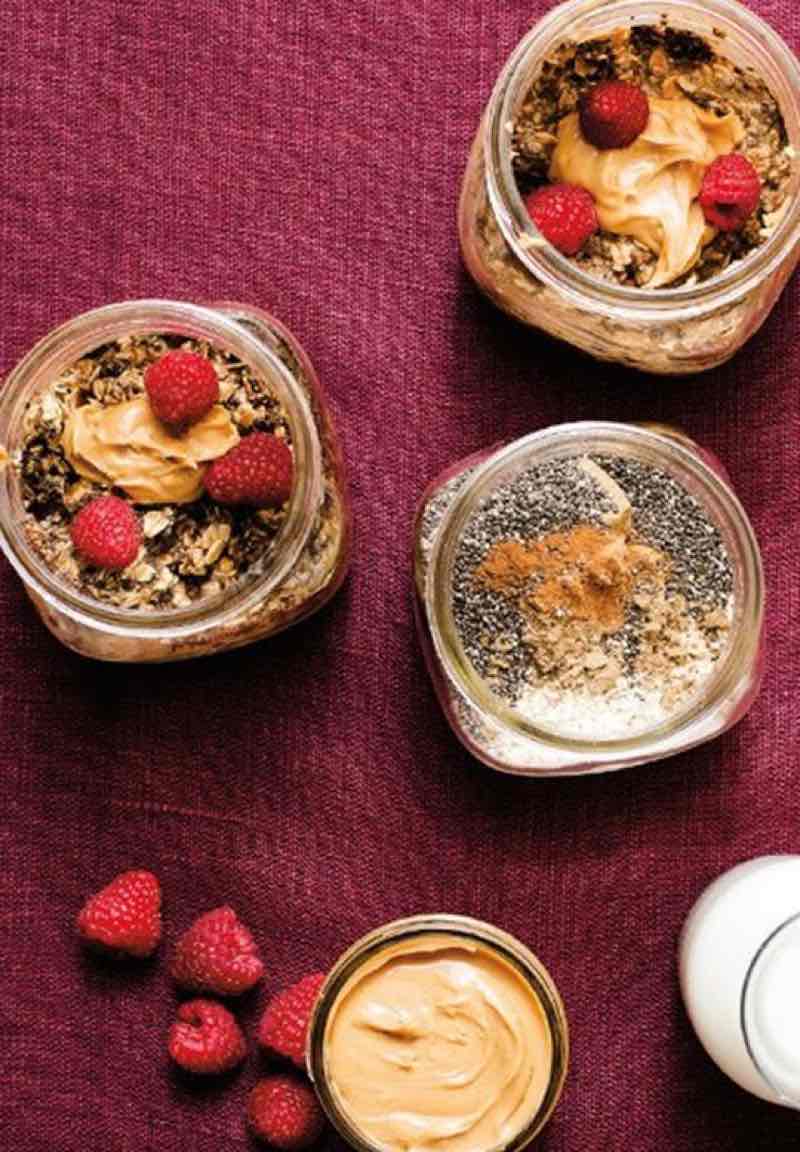
![peanut butter berry and protein oats]()
![knife and fork icon]()
Find easy to make &
Look up Recipes
healthy recipes -
![The Bodybuilding.com Podcast]()
The Bodybuilding.com Podcast
-
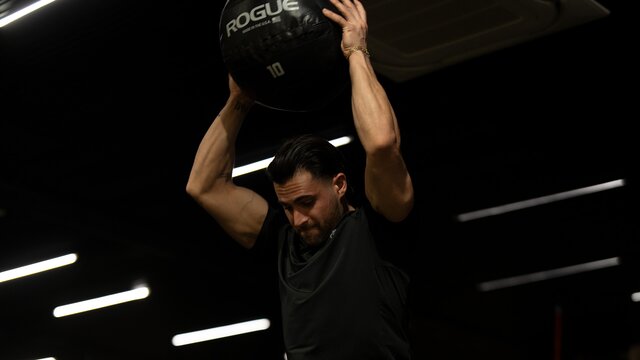
![The Top 4 Benefits of Adding Cold Immersion Therapy Into Your Wellness Routine]()
The Top 4 Benefits of Adding Cold Immersion Therapy Into Your Wellness Routine
-
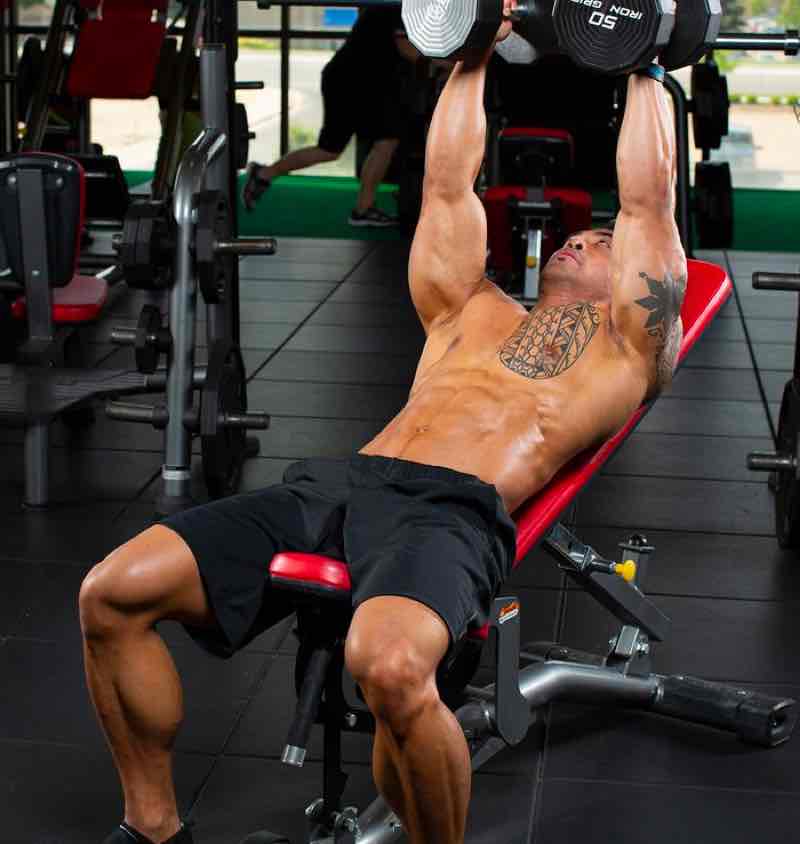
![We Are Elite]()
We Are Elite
-
![Bodybuilding.com Elite Thermo + BCAAs]()
Bodybuilding.com Elite Thermo + BCAAs
-
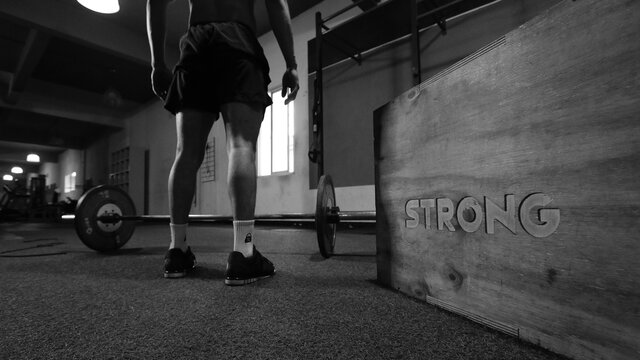
![How to Use "Smart" Supplements as Ergogenics]()
How to Use "Smart" Supplements as Ergogenics